Some of the most useful things a TrueContext document can show aren't fields at all. They're computed visuals: a bar chart of this quarter's numbers, a radar of assessment scores, a diagram drawn from submission data. The challenge is that building those directly inside a single PDF document gets awkward fast. Anything involving iteration, scaling, or geometry fights the layout engine, and the chart logic ends up tangled into the report layout.
There's a cleaner pattern: split the work across two documents. One document does nothing but generate the chart as an SVG image. A second document, your actual report, pulls that image in with a single function call. This article walks through how it works, with a complete working example you can paste and run, and shows you how to connect it to your own form.
How the Two-Document Pattern Works
The pattern relies on one TrueContext capability: a document can embed the rendered output of another document using the documents() function.
Document A, the chart generator. This is a Custom FreeMarker Text Document whose entire output is an <svg> element. It reads submission data, does whatever math the chart needs (scaling bars, plotting points), and emits vector graphics. It has one job and can be tested on its own.
Document B, the composing report. This is your Custom PDF Document. Where you want the chart, you call documents('DocumentA_UniqueID').bytes. TrueContext renders Document A for the current submission, hands back its bytes Base64-encoded, and you drop those into an image tag:
<img src="data:image/svg+xml;base64,${documents('SalesBarSVG').bytes}"
     width="640" height="400" />
The data:image/svg+xml;base64, prefix is the key part. It tells Ecrion's image decoder to treat the bytes as SVG, so the chart renders as crisp vector graphics in the PDF with no rasterization. The chart logic lives entirely in Document A; the report never sees it.
Why split it? The generator becomes independently testable, reusable across multiple reports (PDF or HTML), and your report document stays clean. Each chart is one small, focused document instead of a tangle inside a long layout.
A Complete Working Example
Here's a five-bar chart, start to finish. First, Document A, the generator. The data is defined inline at the top so you can paste this and see a chart immediately, before wiring it to any form.
Document A: SalesBarSVG
<#ftl output_format="XML">
<#--
  ============================================================
  Two-Doc Pattern DEMO - Doc A: Bar Chart SVG Generator
  ============================================================
  Standalone doc that outputs ONE <svg>. The composing PDF (Doc B)
  embeds it via documents('SalesBarSVG').bytes.

  SELF-CONTAINED: the five values are defined inline below so this
  renders with no form dependency - paste it, preview it, see a chart.
  To use real data, replace the `data` list with your field paths, e.g.:
    <#assign data = [
      {"label":"North",  "value": (dataRecord.pages.pSales.sections.sRegions.answers.North.values[0])!0 },
      ... ]>

  Config: Custom FreeMarker Text Document
          Unique ID:      SalesBarSVG
          File Extension: svg
          Content Type:   image/svg+xml
  ============================================================ -->

<#-- ===== inline demo data (swap for real field paths to go live) ===== -->
<#assign data = [
  {"label":"North",     "value": 72},
  {"label":"South",     "value": 58},
  {"label":"East",      "value": 91},
  {"label":"West",      "value": 44},
  {"label":"Central",   "value": 67}
]>

<#-- ===== helpers ===== -->
<#function r1 n><#return (n * 10)?round / 10></#function>

<#-- find max for auto-scaling the Y axis to a "nice" ceiling -->
<#assign maxVal = 0>
<#list data as d><#if d.value gt maxVal><#assign maxVal = d.value></#if></#list>
<#-- round ceiling up to next multiple of 20 -->
<#assign yMax = (((maxVal / 20)?ceiling) * 20)>
<#if yMax lt 20><#assign yMax = 20></#if>

<#-- ===== geometry ===== -->
<#assign W = 640><#assign H = 400>
<#assign padL = 50><#assign padR = 20><#assign padT = 50><#assign padB = 50>
<#assign plotW = W - padL - padR>
<#assign plotH = H - padT - padB>
<#assign n = data?size>
<#assign gap = 18>
<#assign barW = r1((plotW - gap * (n - 1)) / n)>

<#assign NAVY="#003B5C"><#assign GREEN="#00A86B"><#assign GRID="#e6e9ec"><#assign INK="#2b3138"><#assign MUTE="#6b7680">

<#function barX i><#return r1(padL + i * (barW + gap))></#function>
<#function yPix v><#return r1(padT + plotH - (v / yMax) * plotH)></#function>

<svg viewBox="0 0 ${W} ${H}" width="${W}" height="${H}" xmlns="http://www.w3.org/2000/svg" font-family="Arial, Helvetica, sans-serif">
  <rect width="${W}" height="${H}" fill="#ffffff"/>

  <text x="${padL}" y="28" font-size="16" font-weight="bold" fill="${NAVY}">Quarterly Sales by Region</text>

  <#-- gridlines + Y axis labels at 0, 25, 50, 75, 100% of yMax -->
  <#list 0..4 as g>
    <#assign gv = yMax * g / 4>
    <#assign gy = yPix(gv)>
    <line x1="${padL}" y1="${gy}" x2="${W - padR}" y2="${gy}" stroke="${GRID}" stroke-width="1"/>
    <text x="${padL - 8}" y="${gy + 4}" text-anchor="end" font-size="9" fill="${MUTE}">${gv?int}</text>
  </#list>

  <#-- bars + value labels + category labels -->
  <#list data as d>
    <#assign x = barX(d?index)>
    <#assign y = yPix(d.value)>
    <#assign h = r1(padT + plotH - y)>
    <rect x="${x}" y="${y}" width="${barW}" height="${h}" fill="${NAVY}" rx="2"/>
    <text x="${r1(x + barW/2)}" y="${y - 6}" text-anchor="middle" font-size="10" font-weight="bold" fill="${NAVY}">${d.value?int}</text>
    <text x="${r1(x + barW/2)}" y="${H - padB + 16}" text-anchor="middle" font-size="10" fill="${INK}">${d.label}</text>
  </#list>

  <#-- baseline -->
  <line x1="${padL}" y1="${yPix(0)}" x2="${W - padR}" y2="${yPix(0)}" stroke="${INK}" stroke-width="1.2"/>
</svg>
Create this as a Custom FreeMarker Text Document. Give it the Document Unique Identifier SalesBarSVG and Data Node Format All Labels as Node Names. For File Extension, txt works fine and Content Type can be left empty. The data:image/svg+xml prefix in Document B is what tells the renderer it's SVG, so the generator doesn't need a special content type to embed correctly. Paste the template into the editor.
Document B: the report that embeds it
<#--
============================================================
Two-Doc Pattern DEMO - Doc B: Composing PDF
============================================================
Holds NO chart geometry. Pulls in the chart doc (Doc A) via
documents('SalesBarSVG').bytes and embeds it as base64 SVG.
documents('SalesBarSVG').bytes
-> TC fully renders Doc A for this submission, returns its
bytes platform-base64-encoded
<img src="data:image/svg+xml;base64,${...}">
-> routes through Ecrion's image decoder (handles base64 SVG)
-> rendered as native vector graphics in the PDF
Both docs must be linked to the same form AND same FormSpace.
The Unique ID string below must EXACTLY match Doc A's Document
Unique Identifier - typos surface only at render time.
Config: Custom PDF Document
Template Type: FreeMarker
Body Layout: Custom
============================================================ -->
<style>
body { font-family: Arial, Helvetica, sans-serif; color: #2b3138; }
h1 { font-size: 18pt; color: #003B5C; margin: 0 0 0.2em 0; }
.sub { font-size: 10pt; color: #6b7680; margin: 0 0 1.2em 0; }
.chart-block { page-break-inside: avoid; margin: 0.5em 0; text-align: center; }
.chart-block img { display: inline-block; }
.note { font-size: 9pt; color: #6b7680; margin-top: 1em; border-top: 1px solid #e6e9ec; padding-top: 0.6em; }
</style>
<h1>Regional Sales Report</h1>
<p class="sub">Generated by TrueContext · chart embedded from a separate SVG document</p>
<div class="chart-block">
<img src="data:image/svg+xml;base64,${documents('SalesBarSVG').bytes}"
width="640" height="400" alt="Quarterly Sales by Region"/>
</div>
<p class="note">
The chart above is produced by a standalone FreeMarker document
(<b>SalesBarSVG</b>) that outputs SVG. This PDF document embeds it
with a single <b>documents()</b> call — no chart code lives here.
</p>
Create this as a Custom PDF Document. On the Formatting tab, set Body Layout to Custom and Template Type to FreeMarker, then click Launch Document Editor and paste the template into the HTML tab. Link both documents to the same form and the same FormSpace, which is a requirement for documents() to resolve. Render Document B and the chart appears inside your report.
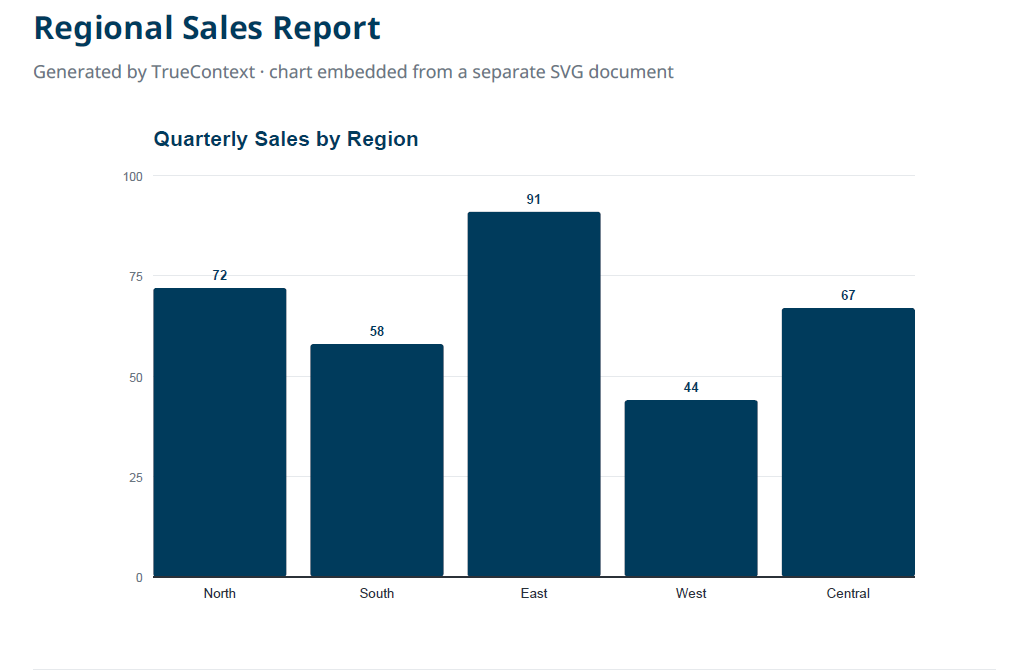
One thing to watch: the string inside documents('...') must match Document A's Unique Identifier exactly, and it's only validated when the PDF actually renders, so a typo won't warn you at configuration time.
Connecting It to Your Own Form
The demo uses inline numbers so the mechanism is easy to see. To make it real, you replace that inline data list with values pulled from your form.
Finding your data paths
In Document A the data path looks like dataRecord.pages.PAGE.sections.SECTION.answers.FIELD.values[0]. The names in that path come from your form's structure. With Data Node Format set to All Labels as Node Names, those keys generally match your field labels, though on larger forms they can occasionally be shortened or renumbered to stay unique, so it's worth confirming rather than assuming.
The simplest way to confirm a path is the Ecrion Input File button on the document's editing screen, next to Preview. It shows you the exact data tree TrueContext feeds the template for a given submission: every page, section, and answer key, with values. Read the real keys off that tree and use them directly in your template.
Swapping the inline data for your fields
Once you know the real keys, replace the inline data block in Document A with values pulled from your submission:
<#-- Instead of inline demo values, pull from your form's fields.
     Use the exact node keys from Path Finder (page / section / answer). -->
<#assign s = dataRecord.pages.pSales.sections.sRegions.answers>
<#function num key><#return ((s[key].values[0])!"0")?number></#function>

<#assign data = [
  {"label":"North",   "value": num("salesNorth")},
  {"label":"South",   "value": num("salesSouth")},
  {"label":"East",    "value": num("salesEast")},
  {"label":"West",    "value": num("salesWest")},
  {"label":"Central", "value": num("salesCentral")}
]>
A couple of details that matter: answer values always come back as an array, so you need .values[0], not just the field. They also arrive as strings, so convert with ?number before any math. And guard for blanks with a default (the !"0" above) so a missing answer doesn't break the render.
If your data repeats
If your values live in a repeating section, one row per region for example, build the list by iterating the rows instead of naming individual fields:
<#-- If your values come from a REPEATING section (one row per region),
     build the list by iterating the rows instead of naming fields. -->
<#assign rows = (dataRecord.pages.pSales.sections.sRegionRepeat.rows)![]>
<#assign data = []>
<#list rows as row>
  <#assign a = row.pages.pRow.sections.sRow.answers>
  <#assign data = data + [{
    "label": (a.regionName.values[0])!"?",
    "value": ((a.regionValue.values[0])!"0")?number
  }]>
</#list>
The rest of the chart code doesn't change. It just draws whatever is in data, however you assembled it.
Where This Leads
A five-bar chart is the simple case, but the pattern doesn't change as the visuals get more ambitious. The same Document A and Document B split handles radar charts, multi-series plots, gauges, and full diagrams, anything you can express as SVG. Because FreeMarker iterates and calculates at render time, charts that would be painful to build directly in the layout engine become straightforward: the generator computes the geometry, the report just embeds the result.
Start with the example above, get it rendering, then point it at your own data. Once the two-document mechanism clicks, it becomes the foundation for nearly any computed visual you want in a TrueContext output.